Understanding price fluctuations in crude oil market and making meaning out of it.
Crude oil, unlike many other commodities, traditionally enjoys very low elasticity of demand and supply compared to its price. That means fluctuation in crude oil price cannot cause proportionate change in demand and supply of crude oil, at least in short to medium term. Now, what does this imply? It implies a sharp increase or decrease in price following any distortion in either side of the supply & demand. This has been observed repeatedly in the global crude oil market.
Recently, international crude oil market is going through a situation when there is no clear indication of a single trend. Contrasting propositions are floating around; both the demand and supply side concerns are cropping up among speculators, investors as well as end users. It this context, let us try to find out analytically how the crude oil price is going to pan out in near future; at least till 2020.
Oil Benchmarks
Before starting the discussion it is important to understand different crude benchmarks. Global crude market is a clutter; roughly, 195 oil streams can be identified across all oil producing regions having different API gravity (density indicator) and sulphur content. Prices vary depending on these differences. So, to make comparison between these oils and to discover suitable prices for different oil streams, prices of oil benchmarks are tracked. Spreads are maintained between benchmarks depending on the factors like, transportations and various regional differences. Mostly 3 different oil benchmarks are prominently maintained and tracked. They are:
- West Texas Intermediate (WTI) – this is sweet and light American oil, produced in Oklahoma. It acts as benchmark for all crude streams from the regions across North and South American.
- Brent blend – this is the common most benchmark oil and is primarily a blend of 15 different streams from North Sea region. This is also light and sweet crude.
- Dubai/Oman Crude – this is comparatively heavy and sour crude and plays a benchmark for all streams from Persian Gulf and Middle East regions.
Different “views” on crude oil demand-supply dynamics and their implications in the market
These are the driving forces behind any price fluctuation in crude oil market. Analysts, researchers, traders are separated into different camps as per their viewpoints on demand and supply economics of crude oil. For any analytical discussion on crude oil prices, it is important to understand these viewpoints.
- Constrained supply view – promotes the scarcity of crude due to depleting levels at conventional oil fields. Such fields, in fact, source around 80% of regular crude supply today.
- Supply elasticity view – argues that in long run higher price of crude will end up stimulating new supply from new sources; because, high crude price would encourage new investments in explorations yielding new sources.
- Business cycle view – proposes that oil price is primarily driven by demand; and demand is driven by business cycle. Recession in businesses reduce demand for crude pulling the price southward. During business booms, demand of crude goes up pushing the price northward.
- Substitution & conservation view – indicates that for any increase in crude price people can shift to energy efficient cars and other substitutes of crude oil today. Besides, conservation efforts are also reducing usage of petroleum products in many sectors. So, the chance of sustained price increase is very limited in crude oil market.
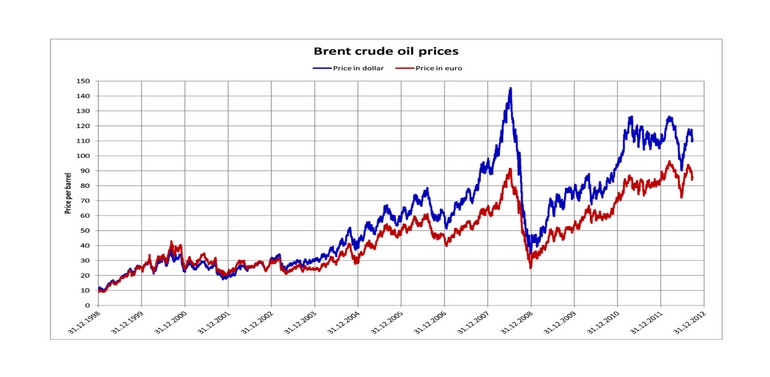
Historical price fluctuations in crude oil market
Being one of the major sources of energy globally, for last 20 years crude oil price is on a positive trend. However, if we reduce the time period to the last 10 years, the price trend seems a little inconclusive. In 2008, crude oil went up to its all-time high of $159.27 per barrel on the back of global supply crisis and economic booms in emerging markets like, China and India. From there, crude price was traded mostly above $80 for next 6 years; till the end of 2014. By December 2014, it breached $60 mark and went down to as low as $29 in early 2016. This was over 80% correction from the peak of 2008; and that too within a time frame of 8 years. The major driving force behind such a steep correction was global economic crisis and the added supply from unconventional sources like shale oil and sand oil. High prices had made production of these oils commercially viable. New investments were made in explorations. Along with that, innovations of energy efficient cars, electric cars also kept demand in check.

Crude Oil price last 20 years

Crude Oil price last 10 year
In recent past crude price has again started going northward. In November 2017, it went above $60, which was the bottom in 2014, and right now trading above $60 mark. Brent blend is trading around $68 while WTI and Dubai crude is fluctuating around $64.
Price forecasts and expectations
Crude price is no doubt at a juncture now where it is difficult to make any unanimous decision on prices. It is evident from different forecasts too. Let us have a look.
- As per the latest World Bank’s Global Economic Prospects’ 2018, we can expect a roughly 9% increase in oil price in 2018 and by 1.7% in 2019.
- In February 2018, Goldman Sachs Bank released a 3, 6 and 12 months’ forecast for Brent Blend and they see Brent trading at around $75 by the end of 2018. From there, the Bank expects a dip in oil price following pumped up supply from non-traditional sources like, shale oil. They also forecast a widening spread between WTI and Brent with a minimum spread of $5.5.
- As per a recent Reuters poll, WTI is going to be traded around $55 throughout 2018. The same for the Brent is around $59.88.
- Following short term forecasts of US Energy Information Administration, crude oil is going to stay around $62 in 2018 and in most of the parts in 2019.
What are the fundamentals playing around in crude oil market recently?
From the forecasts mentioned above, it seems oil is going to be within a range of $55 to $75 for coming 12 to 24 months. Significant upward and downward movements are looking moderately capped. Some of the major fundamentals behind such forecasts are;
- OPEC supply cut – OPEC members and Russians have decided to reduce supply to maintain the price throughout 2018. This year, average supply from OPEC regions is going to be 32.8 million barrels per day (b/d). This going to give support to crude price from downslides.
- US shale oil and alternative energy sources – Shale oil production is increasing for two reasons. Production is becoming more efficient and better crude price is making these sources a lot more profitable. In 2018, estimated average supply from shale oil fields is going to be 9.9 million b/d; an all-time record. This is going to put cap on any potential upside price movements.
- Slower than expected global demand – Global economy is not recovering steadily as it was previously expected. This will keep demand soft in next 12 to 18 months.
- Foreign exchange volatility – volatility in US dollar exchange is going to affect crude price because global crude exporters peg their currencies against USD and crudes are traded internationally in dollar. So, any strength in USD is going to help crude exporters. However, since early 2017 USD index is on a downward slope; if the situation continues then crude price is going to see some dilution.

Source: Global Economic Monitor, LSI Research
Impact of oil price rise on economy
Being a major driving force, fluctuation in crude price leaves significant impact on any economy. For an example, India’s oil import cost was nearly halved between 2014 and 2016. This saving helped government to sponsor some of the domestic infrastructure projects, which were otherwise unviable. Similar, in 2008, when oil was moving above $100, it was becoming unsustainable for many emerging countries like, India, to maintain balance of payments on a regular basis. High oil price also crippled automobile and other oil-dependent industries. It also increased cost of other non-renewable energy sources like, coal, mayoral gas etc.

Source: www.intracen.org
In 2018 budget, Indian government targeted Indian crude basket price at $65; this is $10 more than the target in 2017 budget. For every dollar price increase in Indian basket, government needs to pay out an extra INR 10,000 crore. So, if crude price remains above $65, there would significant pressure on public exchequer.
On the other hand, any downward price correction would make oil-exporting economies significantly vulnerable, like, Venezuela.
Future outlook for international crude oil market
Other than economic factors, political tensions in Middle East will also keep on impacting crude prices. Rivalry between Saudi Arab and Iran is a major concern as both countries want to increase their position in the global crude market. Despite being a member of OPEC, Iran is known to increase their production.

Source: www.marketwatch.com
Also, breakeven US shale oil is at around $50; above $60 producing shale oil is significantly profitable. So, supply from this source is going to rule the market. This means US is fast going to be a significant crude oil exporter. Supply side would also get a boost if Russia manages to find out large repositories from its ongoing exploration drives in far-North Russia.
So, long term trend for crude oil price is looking a little capped. However, due to political tensions and supply management we can expect short term volatility in the market.